Your APM dashboard says everything is fine. P95 latency is normal. Error rate is sitting at 0.4%. No alerts fired overnight. Meanwhile an agent workflow had been retrying far beyond its normal completion pattern. Every session consumed many times its typical token budget, and nobody noticed until finance questioned an unexpected jump in AI spend.
APM was never built to catch this failure mode, or any of the failure modes specific to AI workloads. That's not a knock on the tooling. Your APM platform is excellent at what it was built for, and what it was built for is a genuinely different problem than the one AI workloads present.
APM was built for bounded, request-response systems where a call either succeeds or fails. Agentic AI runs on intentional loops designed to keep cycling until a success condition is met, and that difference in architecture is what turns a single stalled workflow into a cost explosion that standard monitoring never flags.
What APM was built to measure
APM earned its reputation somewhere specific: bounded, request-response systems. Every signal it captures reflects that origin.
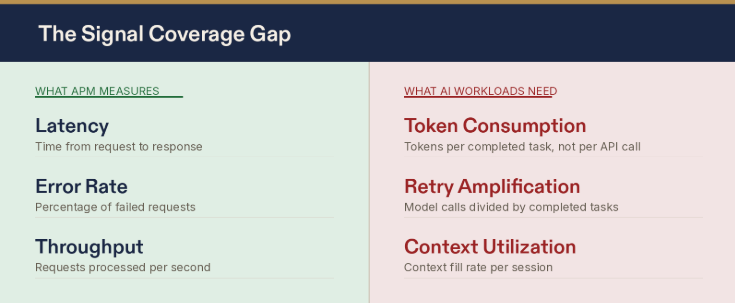
Every mature APM platform ultimately reduces application health to three questions. Modern platforms do far more than measure them, continuous profiling, distributed tracing, resource saturation, but health assessment still comes back to these three.
Latency: did the request complete inside an acceptable window. Error rate: did the request throw an exception or return a bad response. Throughput: how many requests the service is handling per second.
In a traditional microservices architecture, a service that is fast, isn't throwing errors, and can handle load is, in almost every practical sense, working. The system is bounded: a request comes in, a response goes out, and it either matches what you expected or it doesn't.
The fundamental mismatch
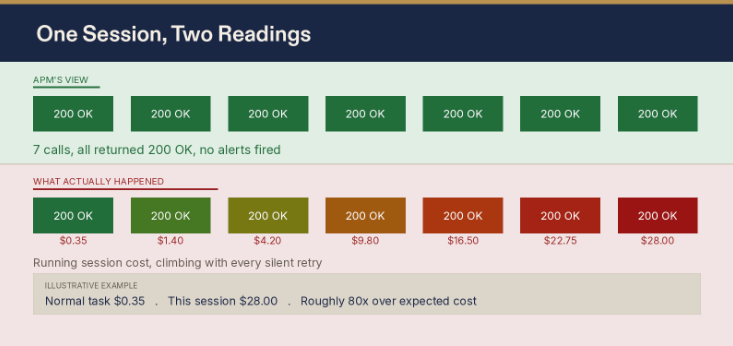
An agentic workflow doesn't execute a fixed sequence of steps the way a traditional service does. The agent decides, call by call, whether to retry, invoke a tool, branch into a different approach, or stop, and that decision path drives most of the cost variation from one run to the next. Two identical prompts sent to the same agent can take entirely different execution paths and produce completions that differ wildly in quality, length, and cost, before even accounting for the model's own sampling, which at typical settings draws each next token from a probability distribution rather than returning one fixed answer. That combination breaks the one assumption APM's entire signal set depends on: that a system is bounded, one request in, one response out, succeed or fail. A session can return a clean HTTP 200 and still be a complete failure by every business measure that matters. There's no binary pass or fail here. Output quality sits on a spectrum, and standard error detection was never built to grade a spectrum. Cost stops being fixed for the same reason: the same task might run $0.02 one time and $0.40 the next, depending on which execution path the agent took and how its sampling played out along the way.
Once that boundedness assumption breaks, none of APM's three signals provide the information needed to manage an AI workload.
Latency tells you how long the model took to answer. It says nothing about whether the answer was worth having, or what it cost to get. Error rate tracks HTTP failures and exceptions. An agent that loops dozens of times before returning garbage still logs each pass as a successful request. Throughput counts requests per second. It has no concept of tokens, context pressure, or output quality per request.
Here's what that looks like in practice. An agent evaluating its own output may invoke the model repeatedly until a validation step succeeds. That's not a malfunction, it's the design working as intended: the agent will not move on until it determines the task is complete. Every one of those invocations can return HTTP 200. None are errors. None trigger alerts. Request-level telemetry records a string of successful calls. It never represents the workflow as one expensive attempt that consumed far more of the model's budget than the task should have required.
The three signals that actually matter
Getting any of them requires instrumentation at a layer APM was never built to reach.
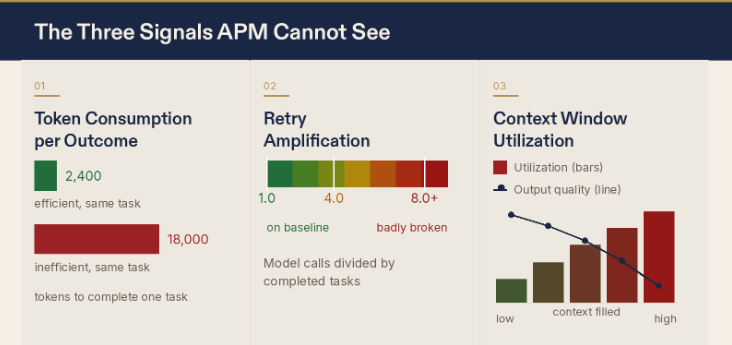
Start with cost, because it's the one finance already noticed. Token consumption per outcome is the number of input and output tokens it takes to complete one business task, measured against the outcome, meaning an accepted, completed workflow, not against any single API call. Standard APM instrumentation terminates at the request boundary, and a single business task might involve twelve separate model calls before it's done, so the relationship between those calls and the outcome they produce is never represented in the underlying telemetry. Tool invocations add to that total too: searches, database lookups, code execution, and other API calls the agent triggers along the way rarely register as model calls at all, which is another reason a task's real cost stays invisible at the request level. Log it yourself and you still hit a wall: APM has no native concept of "business outcome" to normalize the numbers against. An agent that finishes a task in 2,400 tokens is doing meaningfully better work than one that needs 18,000 tokens for the same result, and without this number you can't identify which agents are inefficient, benchmark one prompt against another, or explain a cost swing to anyone outside engineering.
Token count alone doesn't explain why a task cost what it cost. Retry amplification does: Observed Calls divided by Expected Calls, calculated against that specific workflow's own baseline, not some fixed number applied across every workflow. A twelve-call task that runs twelve calls scores 1.0, on baseline, no retries. The same task running ninety-six calls scores 8.0, and a ratio that far above baseline means something is badly broken, usually the thing driving the token number up in the first place. Retries inside an agent loop don't look like errors to APM. They look like successful API calls, because each one is a successful API call, and request-level instrumentation has no field for grouping those calls into a single attempt at one task or establishing what that task's baseline call count should be. Building that view requires tagging every model call with a session ID and a workflow ID at the moment it's made, then correlating those tags the same way a distributed trace correlates spans across services, so a task that took twelve calls or ninety-six shows up as one attributed unit instead of a dozen anonymous requests. That attribution layer sits on top of the APM stack you already have. It doesn't come from inside it.
Retries themselves usually have a cause, and it's often the third signal. Context window utilization is the percentage of a model's context being used in a given session, and how that percentage correlates with the quality of what comes back. There's nothing in traditional distributed systems that maps to this. No HTTP header carries it. No span attribute captures it. No standard metric exists for it, because context window size is a model-level concept foreign to the request-response world APM was built around. As sessions approach the available context limit, orchestration layers begin truncating, summarizing, or otherwise compressing earlier history. The exact behavior depends on the framework, but every approach reduces the information available to subsequent calls, and a model that has lost track of earlier context is more likely to produce an output the agent's validation step rejects, triggering the retry that burns more tokens against a context that's now even more crowded than before.
High utilization often correlates with quality degradation, not just cost, and it's the most common explanation for a failure pattern that becomes increasingly common as session length grows: the agent worked fine in testing and broke in production. Test sessions run short. Production sessions accumulate history until they don't fit anymore, and none of that shows up in standard telemetry, only the successful-looking requests it left behind.
What this means for engineering practice
Fixing this doesn't mean ripping out your APM stack. It means the AI layer needs its own instrumentation, built for a different set of questions.
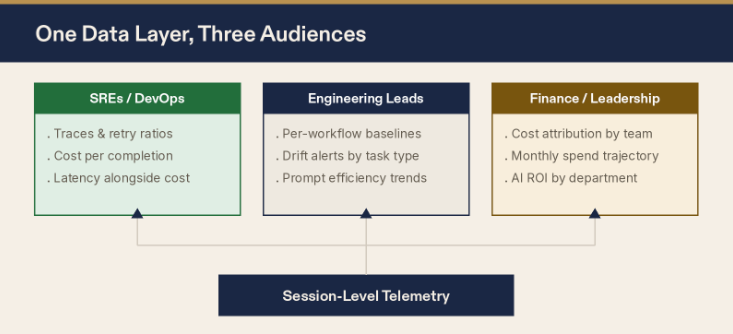
SREs and DevOps need session-level traces: token counts, retry ratios, and cost per completion sitting alongside the latency and error data they already trust. Engineering leads need per-workflow cost baselines, alerts when a workflow drifts from its baseline, and context window utilization trends broken out by task type. Finance and leadership need cost attribution by team and project, a monthly spend trajectory, and anomaly summaries written in terms that don't require a systems background to parse.
A single APM dashboard with AI metrics bolted on as custom fields struggles to serve all three, because its schema is built around individual requests with no aggregation layer to roll them into a session or task. Purpose-built AI observability closes that gap by tracking the session instead of the individual request and calculating cost at the task level instead of the call level.
Where APM vendors are headed
The major APM platforms are starting to build native AI observability. The gap right now is a timing problem: enterprises are running AI in production faster than platform vendors can build the instrumentation layer underneath them.
Current LLM observability features emphasize request inspection: prompts, responses, token counts, and traces. That's genuinely useful for debugging an individual model call. Workflow-level attribution across teams and long-running agents, the retry amplification ratios and cross-team spend forecasting enterprise operations require, remains less mature.
The right mental model
Traditional APM is to AI observability roughly what a packet capture is to application monitoring. A packet capture is indispensable for debugging one connection. It is a poor way to understand application behavior across millions of requests. AI workloads create the same distinction between an individual model call and a complete workflow, and no engineering leader is going to understand AI cost efficiency by staring at the equivalent of a single packet.
Request-level telemetry tells you whether a model call completed successfully. It was never built to tell you whether an entire workflow produced an acceptable outcome for an acceptable cost, and that gap is where the budget disappears.